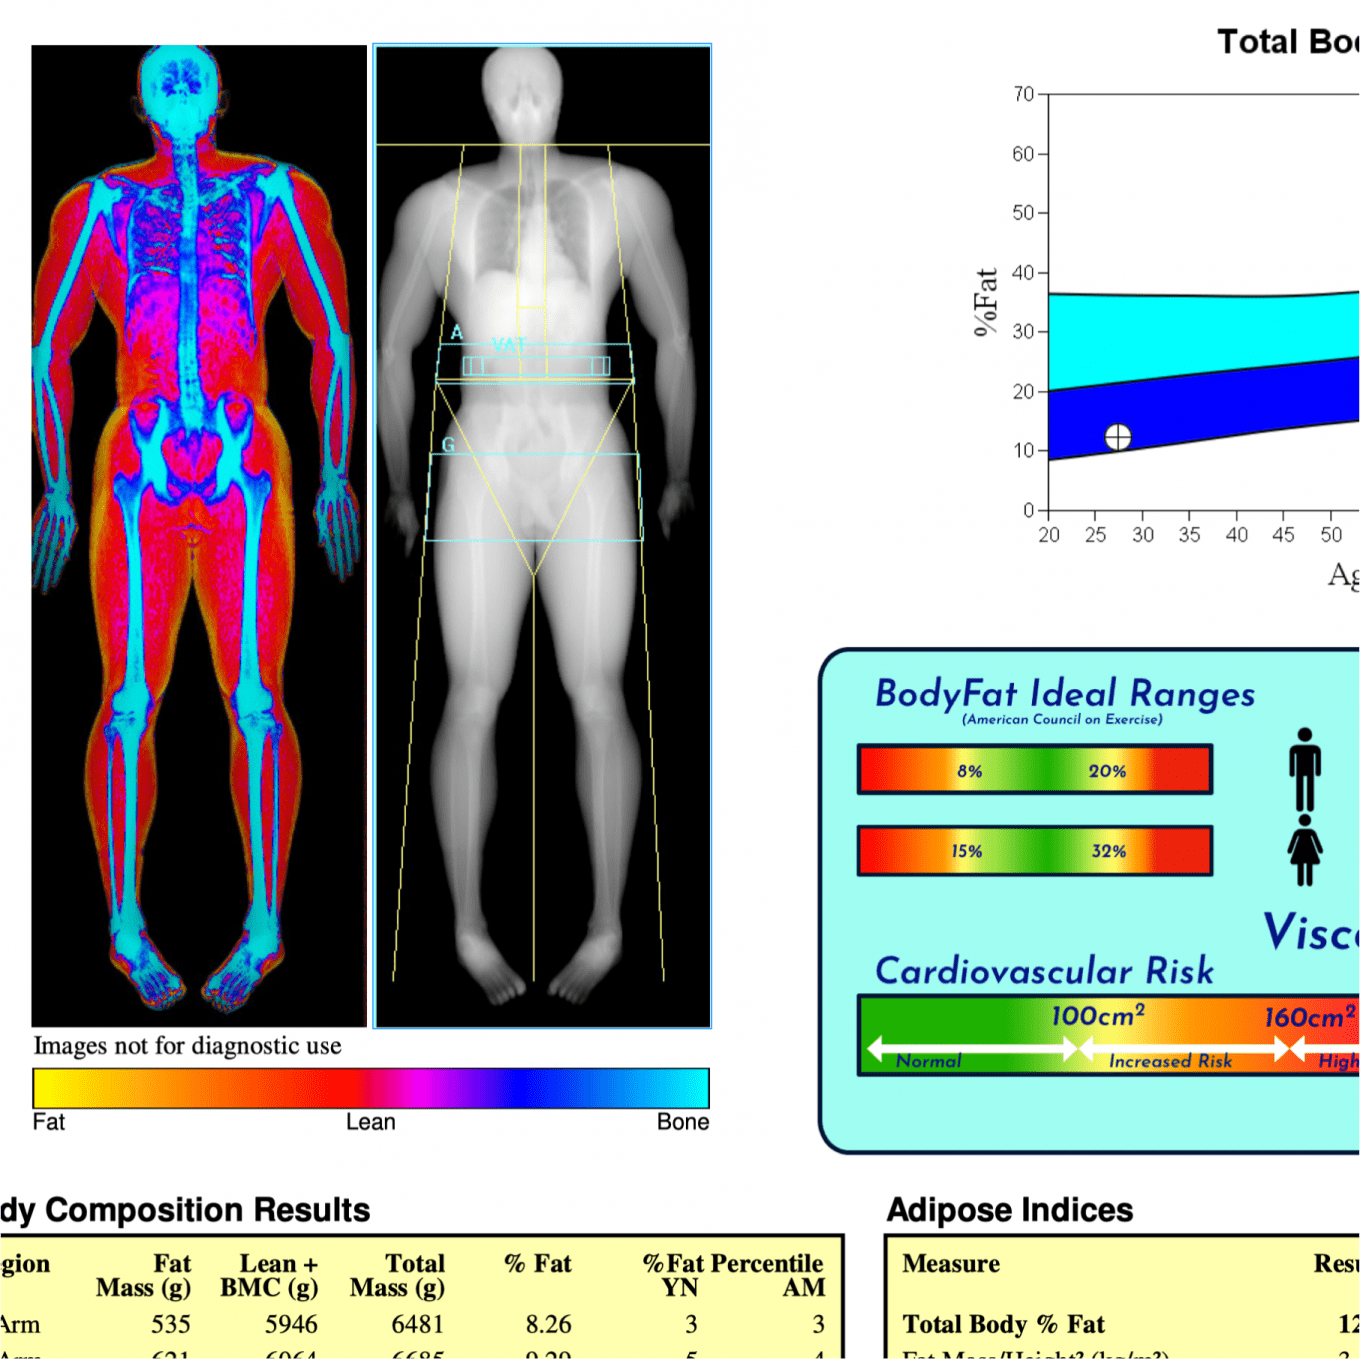
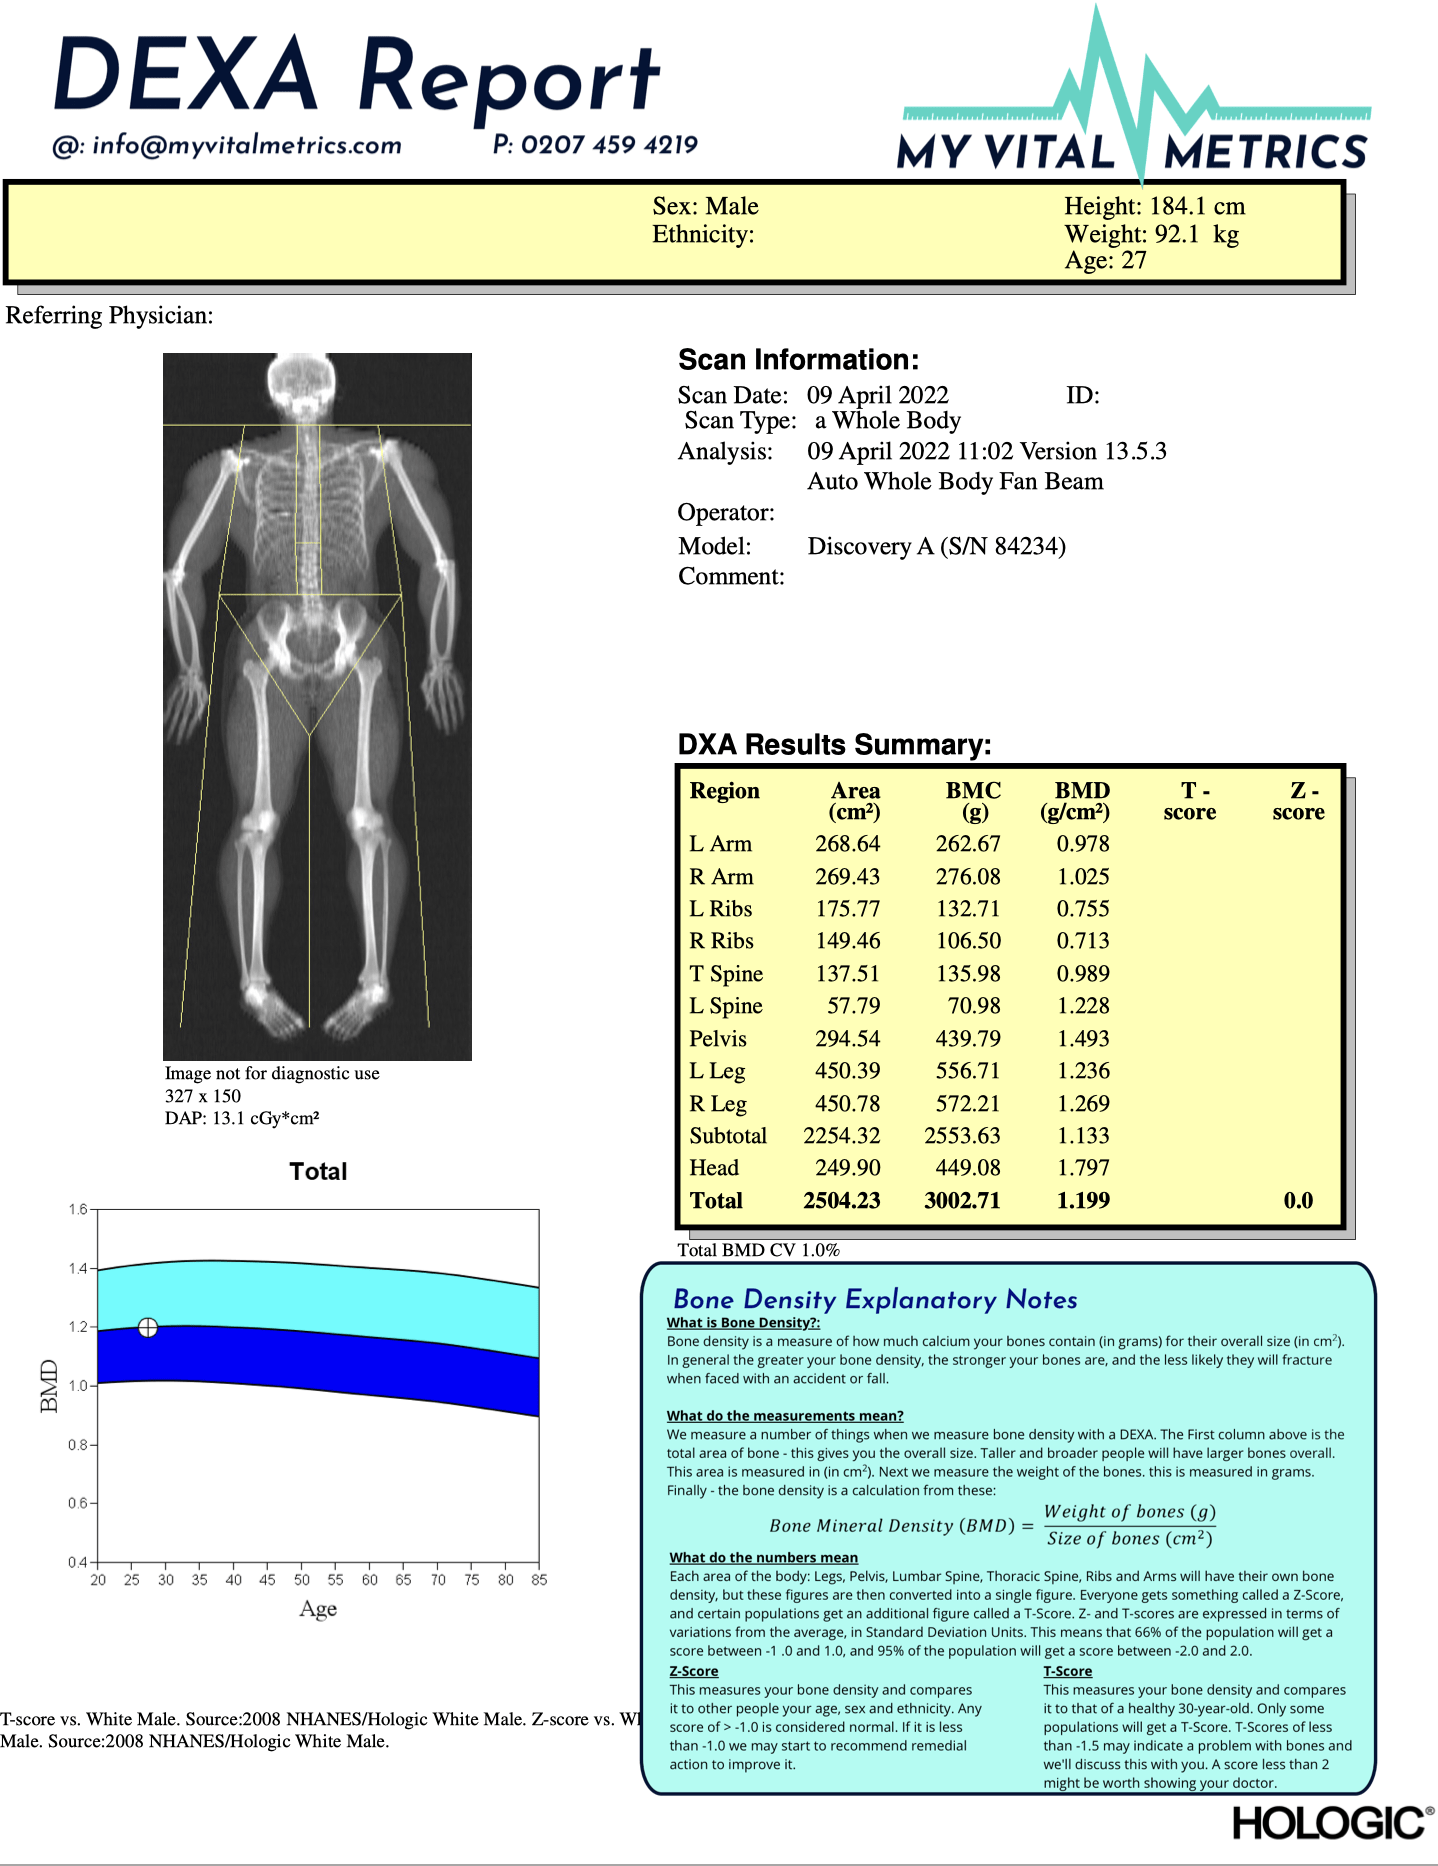
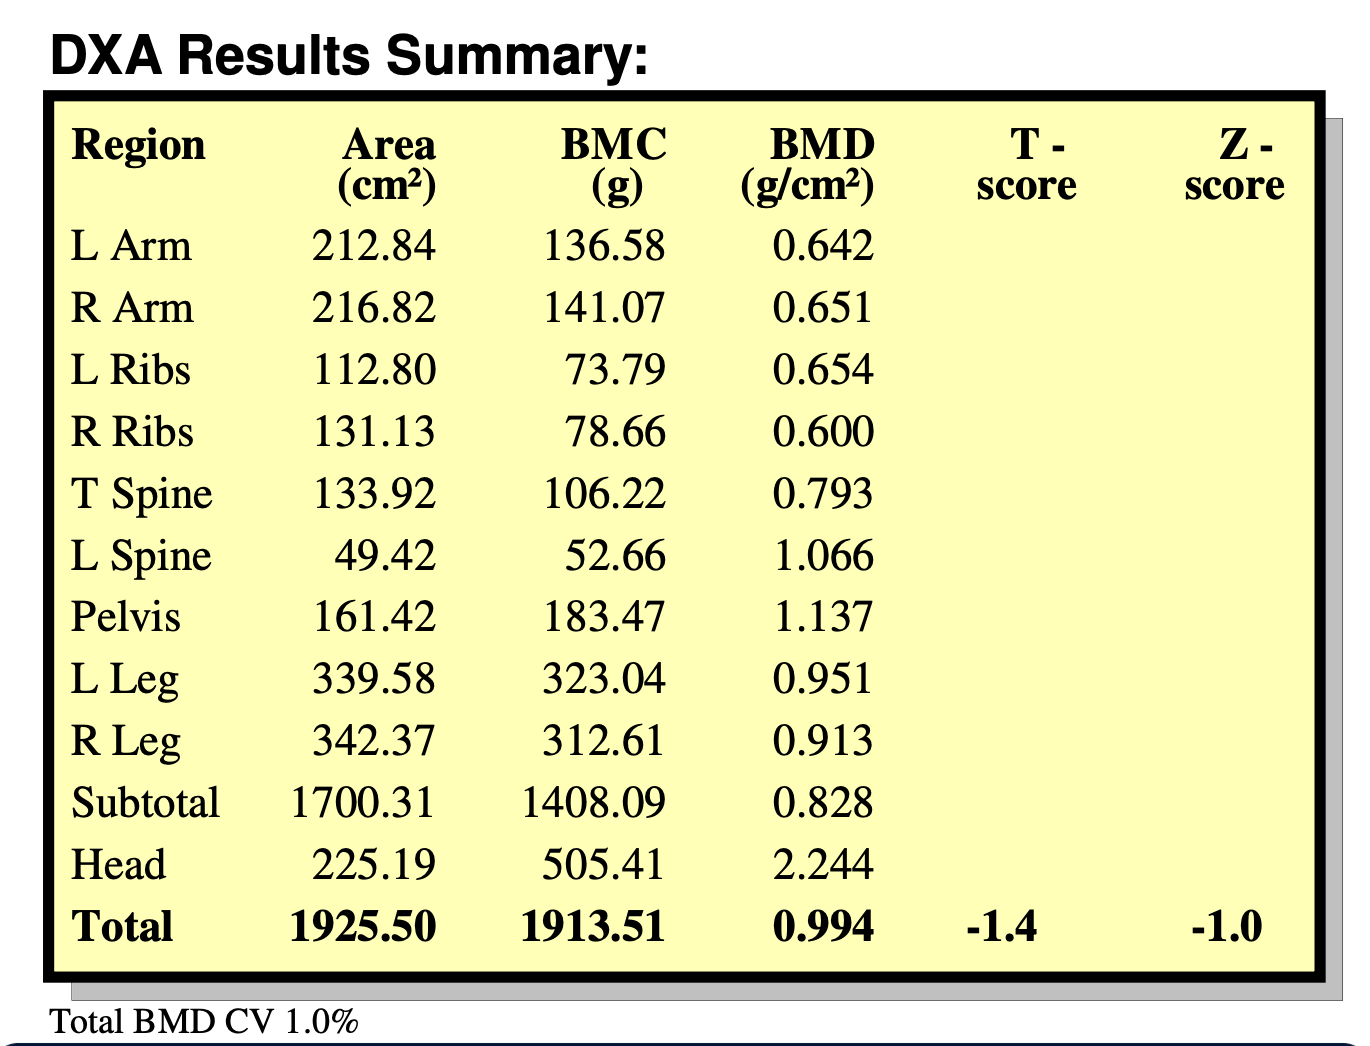
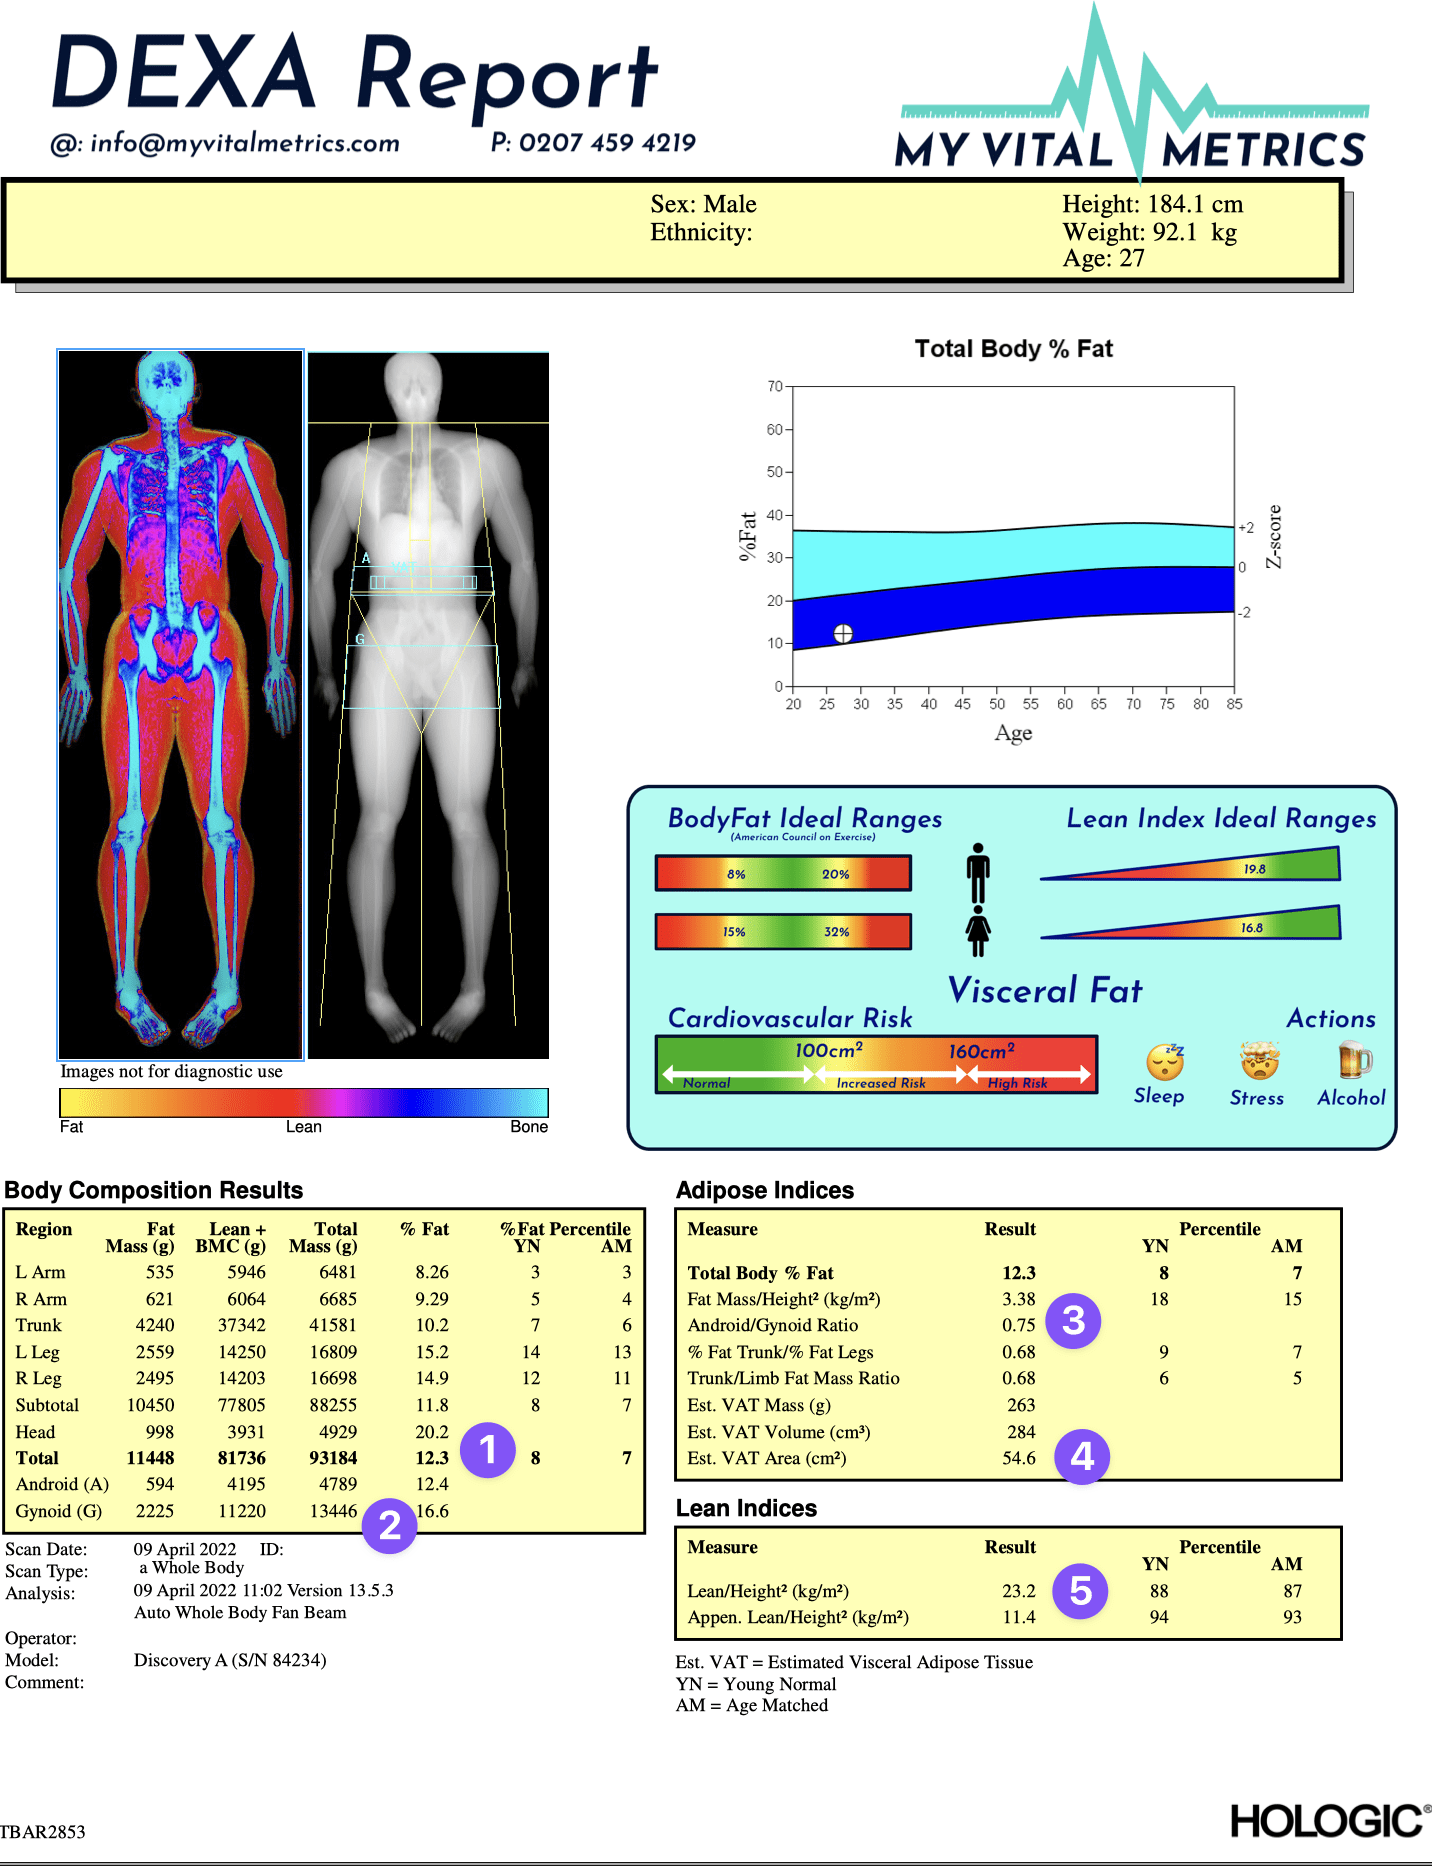
Onto the final page of the main report we see all the figures we have seen on previous pages, just laid out in one big table.
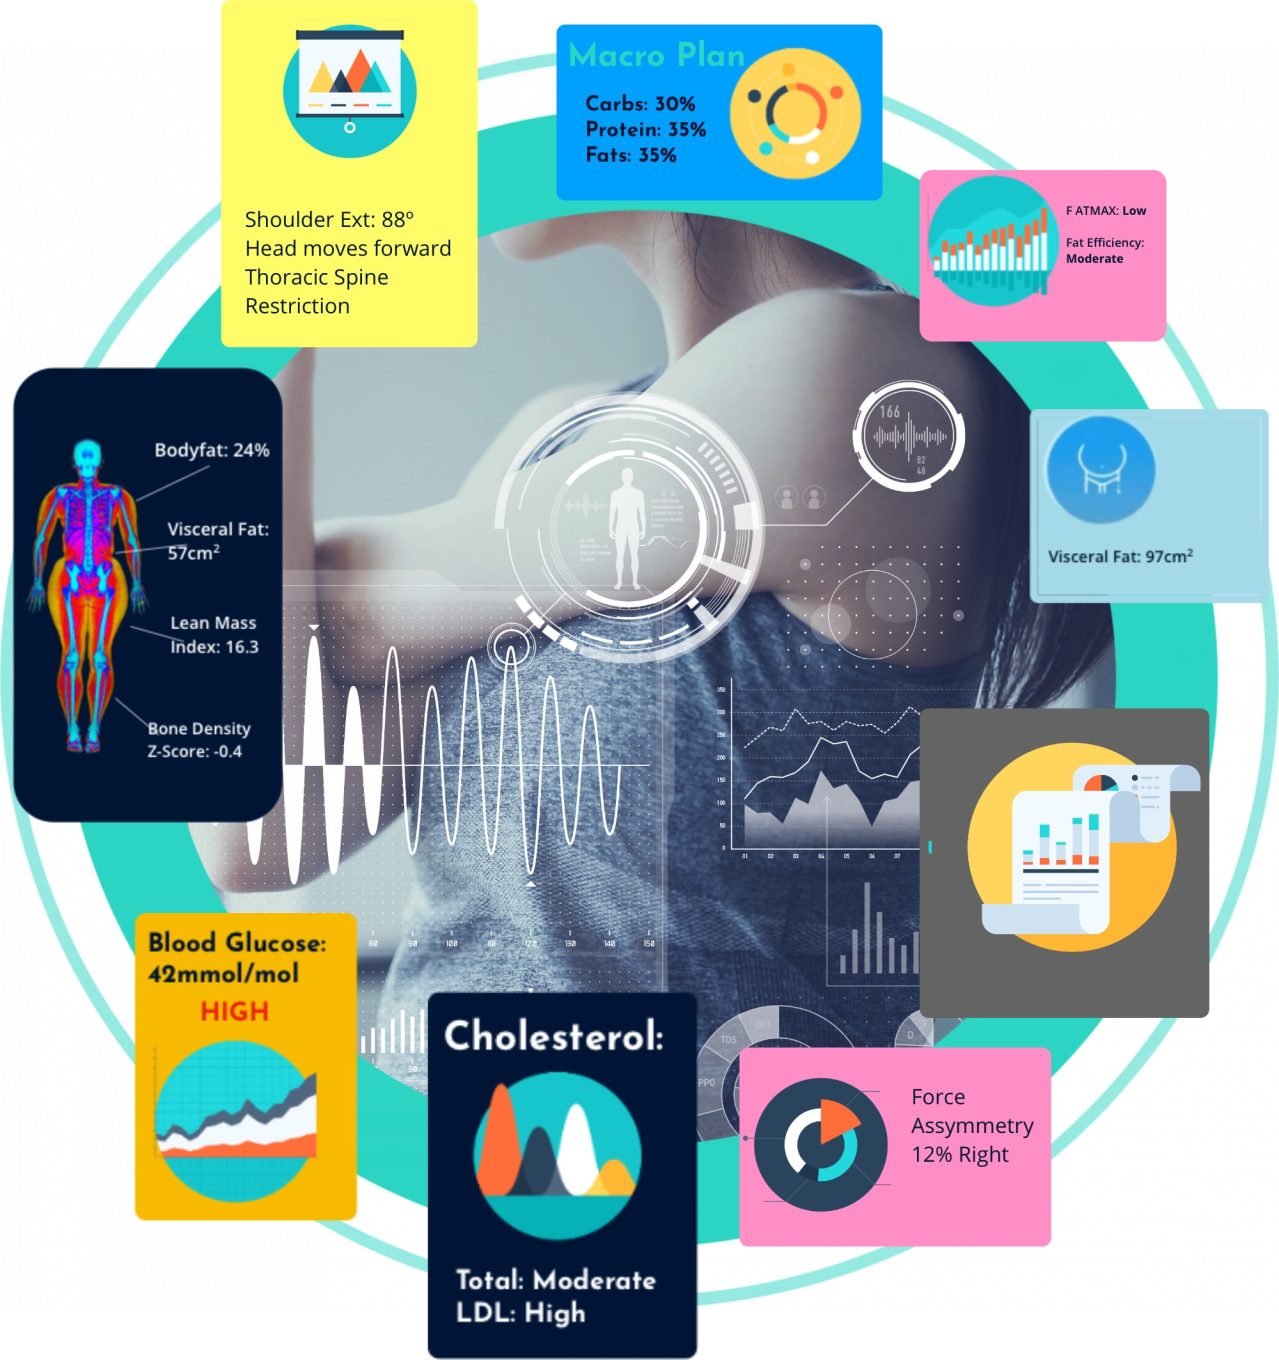
We don’t go over old ground on this page, but instead will just focus on muscular balance. We look at the amount of muscle in the left arm, vs right arm, and in the left leg vs right leg. If they are more than 10% different left to right, we will point this out and discuss remedial actions.
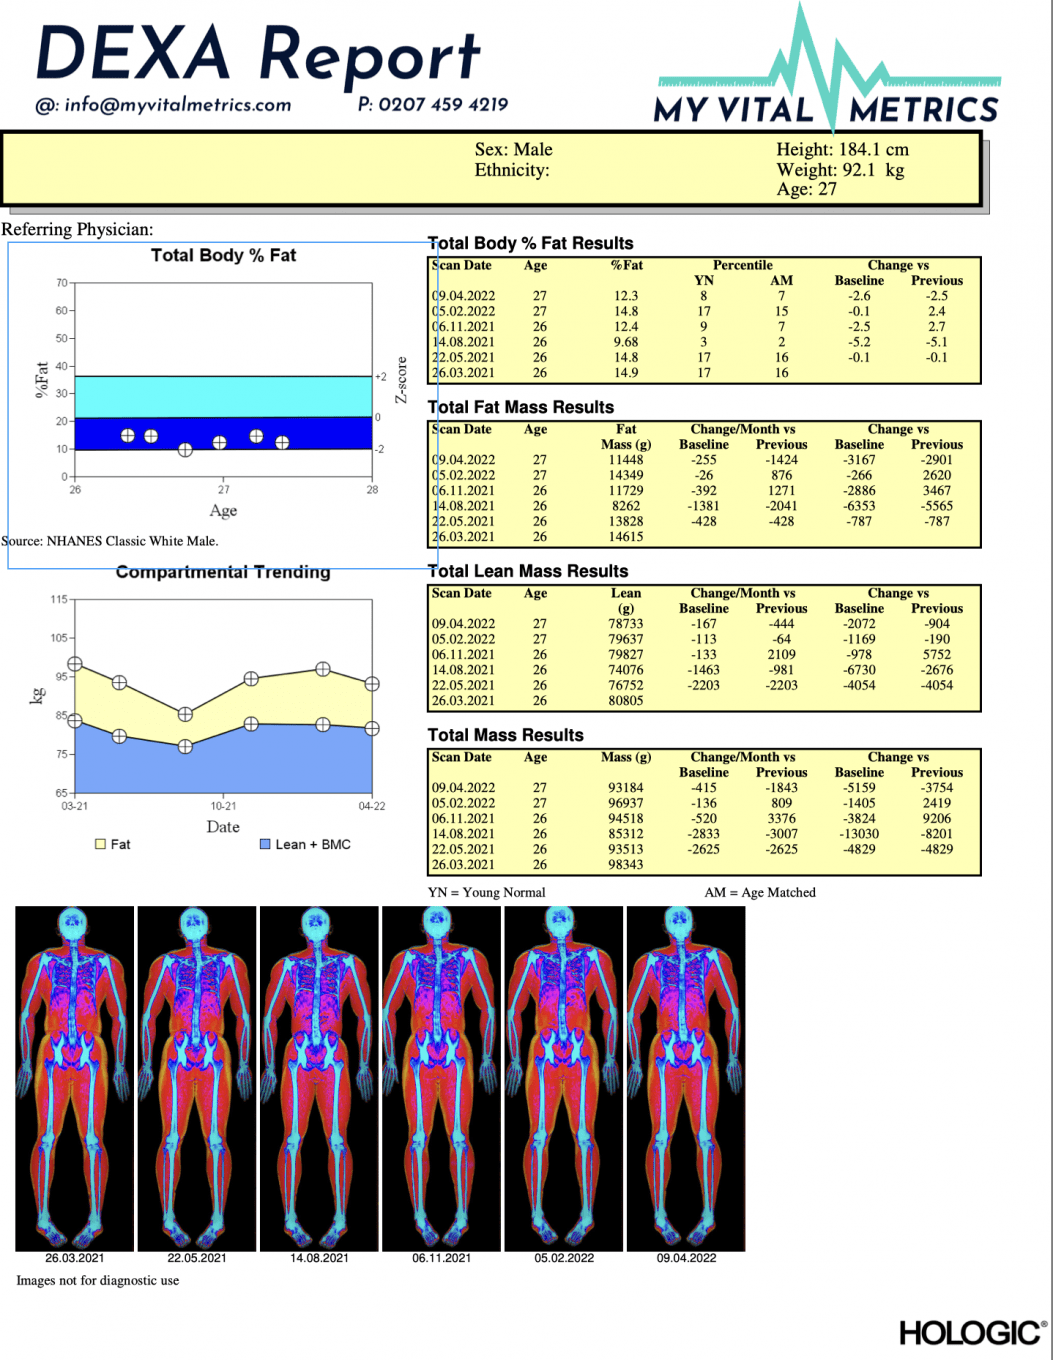
Lastly, when you come in for repeat scans, you get the following page, which shows you exactly how things have changed overall, and each time you’ve come in. Here we can see a young bodybuilder who has been going through a very obvious bulking and cutting cycle – so we are able to track how much lean mass he is putting on in the bulk, and how much fat mass, and how much lean and fat mass he is losing in his cut. As you can see, in this example, he’s done a really good job in each cycle of preserving some of his lean mass through the cut, and limiting the fat gain through the bulk.
After the raw DEXA report, we then turn to the action blueprint which really brings it all together, and turns the figures into an action plan to guide your future efforts. That may be the topic of another post, however.
As ever, with all the above, your personal situation is all-important and context is key. We always try to stick to the best science, and will try not to get drawn on elements for which we feel this isn’t a good scientific basis.
